Wednesday, October 29, 2008

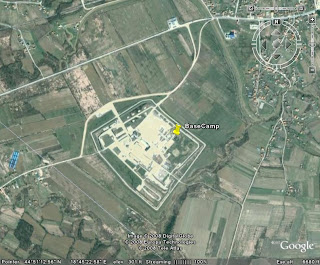
Remote Sensing Image


This is the view of the base camp I was stationed at in Bosnia-Herzegovina from 2001-02, Camp McGovern. It lies on the outskirts of the town of Brcko, the district seat. The reason the details have been distorted is to maintain operational security; the bad guys can utilize this tool just as easily as the good guys. The remote sensing data displayed here is aerial photography. I believe that it is an infrared emulsion, the same type that the USGS uses to produce DOQQ's. I say this because with a DOQQ, true distance can be measured due to corrections in camera angle & relief; true distance can be measured in this image, as well.

Star Plot

A star plot is a graphical method of describing multi-variate observations which include an arbitrary number of variables. These observations are then represented as a star shaped figure; a single ray of proportional length describes the value of each variable. In this plot, the center point is the desired result of a phenomenon with the outlying colored lines representing observations; the results of these are plain to see in relation to the intended target.

Correlation Matrix

A correlation matrix is a graphical representation of the correlation between two numeric variables. The variables are labeled downward in a column and across the bottom in a row; the diagonal of the matrix consists of a value of one. This matrix displays the correlation by use of color; red indicates a positive correlation, green a negative, etc.

Similarity Matrix

A similarity matrix displays value scores that represent similar data between two given points. The data is mapped across the X and Y axes, presenting the user a row/column with which to compare values. The higher the score, the more similarities. This matrix measured the similarities between a group of photos; the peaks of similar values can be obtained from the accompanying scale.

Stem and Leaf Plot

A stem and leaf plot is used to display quantitative data graphically. It is useful in visualizing the 'shape' of a distribution of a phenomenon. This stem and leaf shows the cost of a variable on the left and the frequency of that variable occurring on the right; the distribution is easy to determine.

Box Plot

A box plot is a graphic that displays the center portion of a group of data and information about the data's range. The spacing between each of the points describes the size of the dispersion between observations. This box plot easily describes the numeric value for five separate observations as well as the range they contained.

Histogram

A histogram graphically displays frequencies that have been tabulated, the results being displayed as bars. These bars describe what proportion of cases fall into each of several categories. A histogram differs from a bar graph in that the area of the bar denotes the value, not the height. This histogram describes test results for a group of students; the proportion of students scoring different grades is readily apparent.