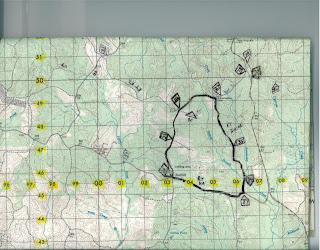
Topographic maps display changes in relief (elevation and depression). They also show man-made as well as natural terrain features(ridge, saddle, river, hills, etc.). Map colors also represent data, such as vegetation. This map is interesting as it is one I used while in the Army. I high-lighted the yellow grid numbers as this helps in low light environments and you can still see the route and corresponding checkpoints drawn in black.

No comments:
Post a Comment